
Home › Forums › BreakawayOne › BAO HD problem
- This topic has 9 replies, 3 voices, and was last updated 9 years, 4 months ago by
po.gustavsson.
-
AuthorPosts
-
March 5, 2017 at 6:07 pm #3276
po.gustavsson
ParticipantI have uninstalled a working BAL installation in our win10 computer for field broadcasts. I have instead installed BAO. The problem is that the BAO only work properly for a few minutes, then it sounds like a machine gun until I restart the BAO… How to debug to find the problem?
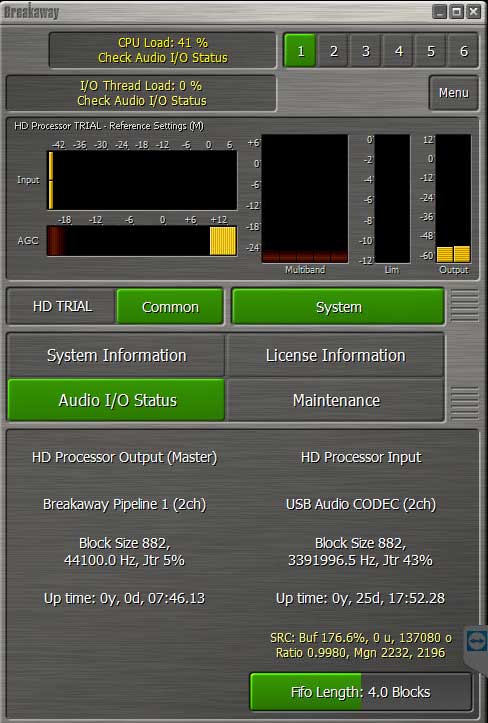
I got a message "Check Audio I/O status". The HD processor output to the pipeline seems to work properly but the HD processor input (from USB audio codec) jumps up ond down in frequency and jtr values. The both block sizes are safe, 882.March 6, 2017 at 12:27 am #14826JesseG
MemberWhile BreakawayOne is running, if you look at:
Common > System > Audio I/O Status
what Fifo Length are you using for that input? March 6, 2017 at 5:19 am #14827Participant
Fifo=4blocks
Attachments:
 March 6, 2017 at 3:06 pm #14828Member
That's pretty wild. Looks like the audio device is sending a massive amount of data, but isn't resetting either. What else is using the usb audio device?
Also what other USB devices are on the computer, and which of those are on the same root hub as the usb audio device?
March 6, 2017 at 8:31 pm #14829James
KeymasterMy M-Audio is at 4 blocks also. I assumed it was the default, as I've never had to touch it.
March 6, 2017 at 9:59 pm #14830ParticipantThe USB soundcard is a Behringer UCA202. The input signal is only routed to BAO.
In another USB-port at the computer a wireless mouse dongle is mounted, no USB hub is used.
It worked properly together with BAL until I uninstall BAL and the old pipeline.March 6, 2017 at 11:04 pm #14831Member[quote author=po.gustavsson link=topic=5406.msg19129#msg19129 date=1488837596]In another USB-port at the computer a wireless mouse dongle is mounted, no USB hub is used.[/quote]
Multiple USB ports can use the same root hub inside of your computer, and usually do on most motherboards. (and almost all motherboards have multiple root hubs) Wireless connection drivers are also notorious for latency spikes. So it's a good question to ask I think. Often each "stack" of USB ports on the back has a different root hub, so that's an easy way to at least see if interference between devices can be resolved by just moving around where they are. You might try moving the wireless dongle to another port on a different "stack" if they are together right now, just as an experiment…But starting with the questions that really should be out of the way before anything else 🙂 …
What interface type are you using for the input in BaOne's config? Kernel Streaming, or Wave?
What is the soundcard's own control panel settings for latency/buffering? When BaOne is running, is the sample rate listed in the soundcard's own control panel actually showing the sample rate that you selected in BaOne (and optionally the soundcard's own control panel, if it's not being allowed to be changed by application/s?)
If you're using Wave interface type, have you checked the "Default Format" sample rate / bit depth setting in Windows' Sound > Recording Devices properties for the input soundcard's listing there?
Just want to know how far you've gone into debugging whatever the problem may be.
The next step after this is to start analyzing any potential latency spikes on the system. But let's make sure the audio path settings don't have anything done incorrectly first. 🙂
March 7, 2017 at 2:50 pm #14832ParticipantNow, all other USB devices are disconnetced.
The problem is still the same.
I always had used KS, never tried wave streaming.
The USB card input is not routed to any wave device, but I have tried it, but no difference.
(44,1kHz, 16 bit).
There is no driver installed – when UCA202 is connected it automatic start the on-board-driver.March 7, 2017 at 8:31 pm #14833MemberLet's take a look at the latencies on your system then.
Read the very basic info here, to understand a little about what this does, and download/install it.
http://www.resplendence.com/latencymonClose BreakawayOne App or stop the BreakawayOne service.
Then run LatencyMon, and press the green "play" button to start monitoring latency. When it seems like the 2nd-4th meters aren't increasing anymore, wait another minute, then press the red "stop" button to stop monitoring.
If LatencyMon says:

then repeat the process again with BaOne App or service running. If it *still* says that, then simply let me know.If not, the please continue.
Then please copy the first report like this:

and paste it in a reply here between code tags. (which you can insert by clicking this button in the font/formatting area of this forum while you're replying: )
)For example 🙂
code :_________________________________________________________________________________________________________<br />CONCLUSION<br />_________________________________________________________________________________________________________<br />Your system appears to be suitable for handling real-time audio and other tasks without dropouts. <br />LatencyMon has been analyzing your system for 0:00:31 (h:mm:ss) on all processors.<br /><br /><br />_________________________________________________________________________________________________________<br />SYSTEM INFORMATION<br />_________________________________________________________________________________________________________<br />Computer name: SSDOMINATOR<br />OS version: Windows 7 Service Pack 1, 6.1, build: 7601 (x64)<br />Hardware: ASRock, P55 Extreme<br />CPU: GenuineIntel Intel(R) Core(TM) i7 CPU 860 @ 2.80GHz<br />Logical processors: 8<br />Processor groups: 1<br />RAM: 16375 MB total<br /><br /><br />_________________________________________________________________________________________________________<br />CPU SPEED<br />_________________________________________________________________________________________________________<br />Reported CPU speed: 2811 MHz<br /><br />Note: reported execution times may be calculated based on a fixed reported CPU speed. Disable variable speed settings like Intel Speed Step and AMD Cool N Quiet in the BIOS setup for more accurate results.<br /><br /><br />_________________________________________________________________________________________________________<br />MEASURED INTERRUPT TO DPC LATENCIES<br />_________________________________________________________________________________________________________<br />The interrupt to DPC latency reflects the measured interval in which a DPC could execute in response to a hardware request from the moment the interrupt service routine started execution.<br /><br />Highest measured interrupt to DPC latency (µs): 249.112174<br />Average measured interrupt to DPC latency (µs): 4.192113<br /><br /><br />_________________________________________________________________________________________________________<br /> REPORTED ISRs<br />_________________________________________________________________________________________________________<br />Interrupt service routines are routines installed by the OS and device drivers that execute in response to a hardware interrupt signal.<br /><br />Highest ISR routine execution time (µs): 167.860192<br />Driver with highest ISR routine execution time: dxgkrnl.sys - DirectX Graphics Kernel, Microsoft Corporation<br /><br />Highest reported total ISR routine time (%): 0.053645<br />Driver with highest ISR total time: dxgkrnl.sys - DirectX Graphics Kernel, Microsoft Corporation<br /><br />Total time spent in ISRs (%) 0.072883<br /><br />ISR count (execution time <250 µs): 39851<br />ISR count (execution time 250-500 µs): 0<br />ISR count (execution time 500-999 µs): 0<br />ISR count (execution time 1000-1999 µs): 0<br />ISR count (execution time 2000-3999 µs): 0<br />ISR count (execution time >=4000 µs): 0<br /><br /><br />_________________________________________________________________________________________________________<br />REPORTED DPCs<br />_________________________________________________________________________________________________________<br />DPC routines are part of the interrupt servicing dispatch mechanism and disable the possibility for a process to utilize the CPU while it is interrupted until the DPC has finished execution.<br /><br />Highest DPC routine execution time (µs): 257.982924<br />Driver with highest DPC routine execution time: nvlddmkm.sys - NVIDIA Windows Kernel Mode Driver, Version 378.66 , NVIDIA Corporation<br /><br />Highest reported total DPC routine time (%): 0.069330<br />Driver with highest DPC total execution time: rspLLL64.sys - Resplendence Latency Monitoring and Auxiliary Kernel Library, Resplendence Software Projects Sp.<br /><br />Total time spent in DPCs (%) 0.247498<br /><br />DPC count (execution time <250 µs): 252099<br />DPC count (execution time 250-500 µs): 0<br />DPC count (execution time 500-999 µs): 1<br />DPC count (execution time 1000-1999 µs): 0<br />DPC count (execution time 2000-3999 µs): 0<br />DPC count (execution time >=4000 µs): 0<br /><br /><br />_________________________________________________________________________________________________________<br /> REPORTED HARD PAGEFAULTS<br />_________________________________________________________________________________________________________<br />Hard pagefaults are events that get triggered by making use of virtual memory that is not resident in RAM but backed by a memory mapped file on disk. The process of resolving the hard pagefault requires reading in the memory from disk while the process is interrupted and blocked from execution.<br /><br /><br />Process with highest pagefault count: chrome.exe<br /><br />Total number of hard pagefaults 1<br />Hard pagefault count of hardest hit process: 1<br />Highest hard pagefault resolution time (µs): 11.133404<br />Total time spent in hard pagefaults (%): 0.000004<br />Number of processes hit: 1<br /><br /><br />_________________________________________________________________________________________________________<br /> PER CPU DATA<br />_________________________________________________________________________________________________________<br />CPU 0 Interrupt cycle time (s): 0.601174<br />CPU 0 ISR highest execution time (µs): 99.373533<br />CPU 0 ISR total execution time (s): 0.027945<br />CPU 0 ISR count: 31381<br />CPU 0 DPC highest execution time (µs): 136.338314<br />CPU 0 DPC total execution time (s): 0.221039<br />CPU 0 DPC count: 167816<br />_________________________________________________________________________________________________________<br />CPU 1 Interrupt cycle time (s): 0.170953<br />CPU 1 ISR highest execution time (µs): 9.009249<br />CPU 1 ISR total execution time (s): 0.001496<br />CPU 1 ISR count: 285<br />CPU 1 DPC highest execution time (µs): 84.583778<br />CPU 1 DPC total execution time (s): 0.003217<br />CPU 1 DPC count: 930<br />_________________________________________________________________________________________________________<br />CPU 2 Interrupt cycle time (s): 0.191277<br />CPU 2 ISR highest execution time (µs): 8.114194<br />CPU 2 ISR total execution time (s): 0.000720<br />CPU 2 ISR count: 141<br />CPU 2 DPC highest execution time (µs): 140.123799<br />CPU 2 DPC total execution time (s): 0.023857<br />CPU 2 DPC count: 4684<br />_________________________________________________________________________________________________________<br />CPU 3 Interrupt cycle time (s): 0.153085<br />CPU 3 ISR highest execution time (µs): 14.964781<br />CPU 3 ISR total execution time (s): 0.000146<br />CPU 3 ISR count: 10<br />CPU 3 DPC highest execution time (µs): 44.680896<br />CPU 3 DPC total execution time (s): 0.008062<br />CPU 3 DPC count: 1375<br />_________________________________________________________________________________________________________<br />CPU 4 Interrupt cycle time (s): 0.380591<br />CPU 4 ISR highest execution time (µs): 0.0<br />CPU 4 ISR total execution time (s): 0.0<br />CPU 4 ISR count: 0<br />CPU 4 DPC highest execution time (µs): 93.144077<br />CPU 4 DPC total execution time (s): 0.049773<br />CPU 4 DPC count: 33050<br />_________________________________________________________________________________________________________<br />CPU 5 Interrupt cycle time (s): 0.161991<br />CPU 5 ISR highest execution time (µs): 0.0<br />CPU 5 ISR total execution time (s): 0.0<br />CPU 5 ISR count: 0<br />CPU 5 DPC highest execution time (µs): 0.0<br />CPU 5 DPC total execution time (s): 0.0<br />CPU 5 DPC count: 0<br />_________________________________________________________________________________________________________<br />CPU 6 Interrupt cycle time (s): 0.368786<br />CPU 6 ISR highest execution time (µs): 0.0<br />CPU 6 ISR total execution time (s): 0.0<br />CPU 6 ISR count: 0<br />CPU 6 DPC highest execution time (µs): 105.887940<br />CPU 6 DPC total execution time (s): 0.081814<br />CPU 6 DPC count: 25654<br />_________________________________________________________________________________________________________<br />CPU 7 Interrupt cycle time (s): 0.547412<br />CPU 7 ISR highest execution time (µs): 167.860192<br />CPU 7 ISR total execution time (s): 0.153160<br />CPU 7 ISR count: 8034<br />CPU 7 DPC highest execution time (µs): 257.982924<br />CPU 7 DPC total execution time (s): 0.235259<br />CPU 7 DPC count: 18591<br />_________________________________________________________________________________________________________<br />Then please run BreakawayOne App or start the service, and do the same thing with LatencyMon and copy/paste that second report into code tags also.
It could also be beneficial to pay attention to LatencyMon meters to see if something suddenly increases any of them exactly when the skipping in BaOne starts happening. If that does happen, then stop LatencyMon immediately and copy/paste that, since that will surely show (at least part of) whatever is causing this to happen.
It may also be useful to see what your top ISR and DPC counts are for your drivers…

 March 8, 2017 at 10:24 pm #14834Participant
First LatencyMon showed good values but after a minute it turned red. I then tried to update the BIOS, but it failed. So the computer is now in the repair shop 🙂
The process continues… -
AuthorPosts
- You must be logged in to reply to this topic.